
Pixel and RGB
The Digital World
Nowadays the computer is part of the life of most common citizens, be it at work, or at home. We are quickly evolving from literacy to computerization. Soon, those who are not computerized will, in turn, be illiterate.
In our world everything is getting digitalized. Images are now almost exclusively captured and stored in digital format and those who still have them in analog format, seek their digitalization. Professional photographers already use digital support for their work. Who amongst us does not have a digital camera, even if only in the mobile phone?
Sound too is almost all in digital format. It has been this way since the arrival of the CD. They are recorded and stored in digital format. Most tape recorders already use digital format. Therefore, we can say that sound too, nowadays, is almost exclusively in digital format.
TV is now broadcasting exclusively in digital format, and movies are now all at our disposal, in digital format.
The fabulous world of the Internet has evolved to astonishing levels of people interconnection. We can do almost everything through the Internet. Buying, selling, investigating, reading, studying, interconnecting with official services, mailing, and so on. We dare ask, what can we do without the Internet.
Physical archives are being replaced by digital archives for ease of access, storage space and even ecological reasons. Also, the steady decline in HDD storage costs, in parallel with the growth of its capacity, is contributing in a large scale to the numeralization of our world.
Numeralization? That’s a strange word. What does it mean?
As we know, digital representation is made using numbers comprised of ones and zeroes, also known as the binary system.
But the images the computer shows us on the monitor, graphics and text, do not have anything numeric about them. They are real, and look normal for a human. How can they be comprised of numbers, and still have that aspect?
Well, that’s exactly what we are going to find out right now, how does a computer to, just with ones and zeros, show us the graphical forms we work with, and uses them to communicate with us, how it shows us our photographs and our movies, lets us listen to the music we love most, and how can it take all these things that exist and are real in our world, and turn them into ones and zeros.
The Display Screen
Photos, text, and even the window of a program, all of them are nothing but graphs, as far as the computer is concerned. The letter A, for example, which has a meaning for us, is just a graph, resulting from a specific combination of ones and zeros, and means nothing more than that. The computer only understands the binary digits which compose the graphs shown in the monitor.
So, how does it write or draw in the display things that are different from what it perceives them to be?
Let’s begin by analyzing an image in an LCD screen, in Figure 1.
Now, let’s enlarge this image about 6 times, but not by zooming it. Let us instead use a lens that allows us to get closer to the screen. Why we are using a lens and not zooming in, is something we’ll see further on. The result is shown in Figure 2.
The definition is now a lot lower and the lines look like stairs going up and down.
This means that we are already noticing the structure of the screen, which, due to its amplification, has surpassed our visual levels of definition. With the use of such a lens, we can now see a multitude of little colored squares.
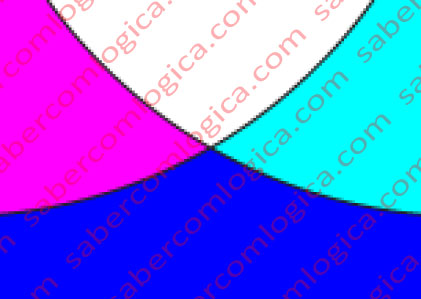
Let’s try to amplify the screen 34 times, using the appropriate lens, as can be seen in Figure 3.
We can now clearly notice that the image is composed of colored squares, each one having a single color. Together, these squares, when properly viewed from a dimension where we cannot distinguish them, comprise the image that we
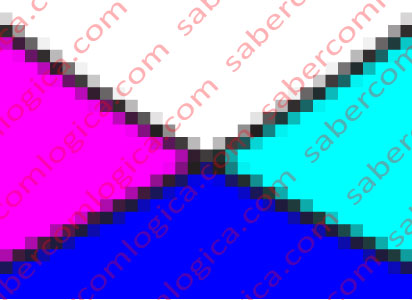
saw in Figure 1.
Those squares are called Pixels, a.k.a., Picture Elements.
For instance, the screen of an LCD is composed of lots of those squares. Let’s specifically analyze a screen with Full HD resolution, with 1920 columns by 1080 lines. It will have 1920 x 1080 pixels, those little squares we saw before, for a total of 2,073,680.
If our screen has an area of approximately 1545 cm2, corresponding to a 24” screen, each pixel will have an area of 0,075 mm2, or rather, the square formed by the pixel will have an edge of 0,27 mm.
Thus, each image presented in our screen is composed of 2.073.680 separate pixels.
And how can that be?
Each pixel can assume only one color, from white to black, and going through all the colors present in the solar spectrum. The bigger the bit depth, the larger the range of colors a pixel can assume.
And what is this bit depth we spoke of?
We’ll start by referencing the letters R, G and B, which can be read as RGB, meaning Red, Green and Blue. With these 3 colors, we can build all the others. The screen we have been referencing up until now, works with the RGB color process.
We can see in Figure 4 how each pixel is composed of 4 micro bulbs, with filters that only allow the emission of Red, Green, or Blue light, with the saturation (amount of light, or intensity of the color) ranging from 0 to 100%. This means that, for each image, we will have to control 2,073,680 x 3 = 6,221,040 bulbs, separately.
The reference to bulbs is only used to facilitate the understanding of this concept, since the method that LCD displays use to produce each color is related to its full name, Liquid Crystal Display. In other words, each color is obtained by the disposition assumed by the crystals in a liquid environment. However, their analysis goes was beyond the scope of this chapter, therefore we will not be discussing them further. LED screens work the same way, the only difference being that the light emission process behind the crystals is done using LED lamps, which are brighter, more efficient, and more trustworthy. Only now are tests being conducted with a screen to which the term LED truly fits, because each pixel will accurately be represented by 3 bulbs.
For the sake of simplicity, let’s then assume that each pixel has 3 bulbs.
The process of defining the bulbs’ light intensity, meaning, the RGB color saturation, can utilize several bit depths. Each color has a specific number of bits which define its saturation. The total number of bits used for all 3 colors, RGB, is what we will call Bit Depth.
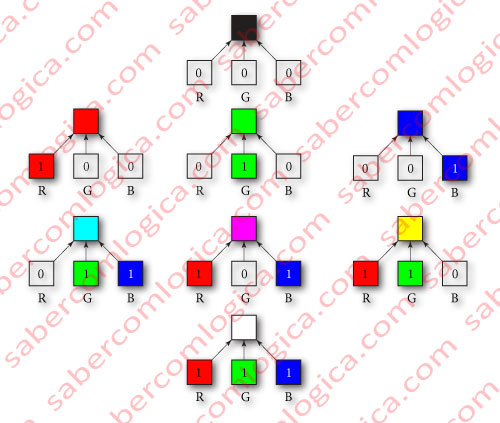
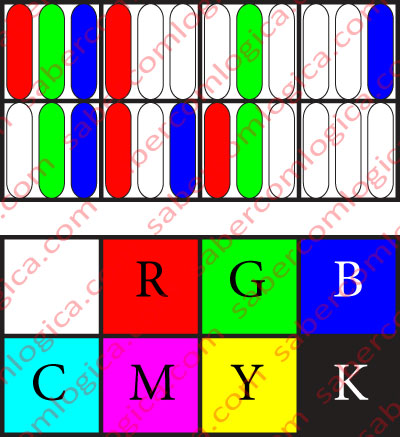
In Figure 5 we can see a representation of a Bit Depth of 3, i.e. 1 bit per color. This way, each color can only have two possible definitions:
- 0, corresponding to 0% saturation, or no bulb’s light intensity.
- 1, corresponding to 100% saturation, or full bulb’s light intensity
Thus, each bulb can only be on or off, meaning they are connected to a switch, not a potentiometer. It’s all or nothing. The color saturation will match the bulb’s light intensity.
In this Figure, the little square which is above the 3 R, G and B squares, represents the color obtained from the combination of the referred 3 RGB ones, according to the intensity in each different situation.
In Figure 4 we represent the same thing in a different manner. In the top 8 squares, we can see the state of each of the bulbs that composes each pixel. In the bottom 8 squares, we can see the resulting for that same pixel.
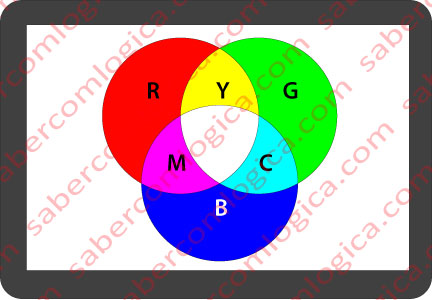
The RGB color process is an additive process. The different colors can be obtained by adding each color’s saturation value of 1, to black (0,0,0). Thus, the various possible combinations are as follows:
- All bulbs off (0,0,0), Black (K).
- Only the Red bulb on (1,0,0), Red (R)
- Only the Green bulb on (0,1,0), Green (G)
- Only the Blue bulb on (0,0,1), Blue (B)
- Green and Blue bulbs on (0,1,1), Cyan (C).
- Red and Blue bulbs on (1,0,1), Magenta (M).
- Red and Green bulbs on (1,1,0), Yellow (Y).
- All bulbs on (1,1,1), White.
We can easily realize this in a practical situation. Imagine that we are inside a dark room, where the walls are completely white, and there are 3 bulbs (R, G and B) inside of it. If they are all off, the room will be totally dark, thus, the walls we be Black. For each bulb we turn on individually, the walls will acquire its color. If we turn on all the bulbs, the room will be fully lit and its walls will assume a white color. This is what we mean by Additive Process.
Now, notice the first letter of each of the colors that are generated by adding two of the others. Now put them together, and add the letter K, for Black. This results in CMYK. This is the color process used to communicate with printers. You have certainly noticed that the printers have 4 inkstands with C, M, Y and K colors, or 2 inkstands, being one for the Black (K) color, and the other for the remaining 3 (C, M, Y) colors.
Images would be very tedious with an eight (2³) color system. A long time ago (in computer terms, a few decades) 16 colors and 256 colors were used to print images onto the screen.
Most modern graphics cards only support 65,536 colors as a bare minimum, meaning a Bit Depth of 16 bits. Given that 16 is not divisible by 3, 5 bits are assigned to red, 5 to blue and 6 to green.
Nowadays, the Bit Depth used in almost all the color displays is 24 bits, or True Color. Each color is defined by 8 bits, which can assume 256 values, allowing us to define the saturation from 0 to 255. The final color will be defined by the sum of each of the R, G and B colors in 256x256x256 combinations, corresponding to a total of about 16.7 million different colors.
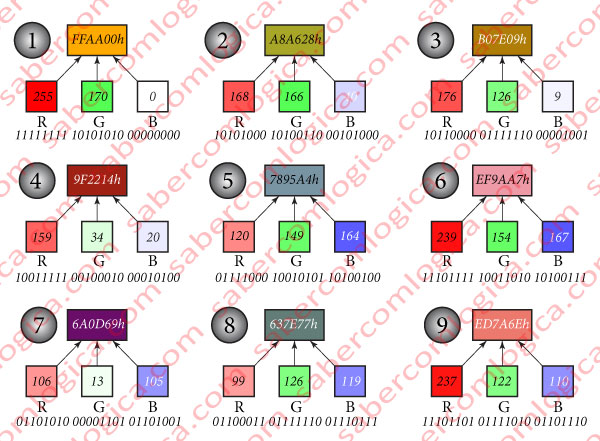
In Figure 6 we present 9 of those possible combinations, represented in rectangles. Below each rectangle there are 3 squares, each representing the saturation of R, G and B colors contributing to the final color. The decimal value of the saturation is described within the square, and beneath it, its binary representation. The value shown within the rectangle of the resulting color is its hexadecimal notation, which is very commonly used in graphic design.
For instance, the representation of the color 8 in machine language would be
011000110111111001110111
and for a human, it would be
637E77h
where h denotes the hexadecimal notation, or even
99R – 126G – 119B
in decimal amounts of Red, Green and Blue, which can go from 0 to 255 each.
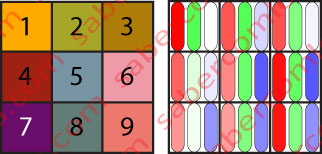
In Figure 7 we can witness the correspondence between the resulting color of the pixel (left side) and the saturation of each of the pixel’s micro bulbs (right side), for the same colors shown in Figure 6.
It’s normal to not able to distinguish a different in the color, when dealing with nearby saturation values, given that:
- When printing on paper, the CMYK saturation limits for printing purposes (depending on the printer profile) are different from the RGB ones, meaning that we cannot reach 0 or 100% for each color.
- Even with a RGB screen representation, we still cannot sense visual differences between colors with similar saturation. However, when represented in a high-definition picture, even if we individually cannot sense the difference, it’s precisely this difference that, when viewed globally, makes photography more defined and contrasted.
A little while ago, we related 24 bits depth to True Color. But what is written in many places is that True Color corresponds to 32 bits depth. How is that?
It’s true. Indeed, for the sake of alignment with the way memory reads in submultiples of 64 bits (the bandwidth of a DIMM), it’s faster to read the memory in 32 bit words, which is also the size of the words in 32 bit processors.
Thus, in the name of efficiency, 8 bits were joined with the previous 24, resulting in 32 bits per pixel, although the information for R, G and B colors remains exactly the same, 8 bits per color, and about 16.7 million colors in total. Currently, graphic cards use these 8 additional bits to add transparency to the image’s definition, with values between 0 and 255, going from opaque to completely transparent. Nowadays, transparency is an important factor in an image’s definition. Therefore, for each pixel, we will now have 32 bits of information, representing approximately 16.7 million colors, each with 256 different degrees of transparency.
So, for each image we send to the display screen, 2,073,680 x 32 = 66,357,760 bits are sent. With a refresh rate of 50 Hz (number of times per second that the screen image is renewed), we will have a flow of 66,357,760 x 50 = 3,317,888,000 bits/s, around 400 MB/s.
In the next article, we will analyze the different digital image types.